Meteorology episode 4: What is the weather forecast on the Internet good for?
YACHT-Redaktion
· 23.10.2022


In this series:
- Part 1: The basics.Wind, air pressure, temperature, humidity and more. What changes these parameters cause in combination
- Part 2: Of highs and lows. What influence the pressure formations have on wind development, how they develop and which constellations can be dangerous for sailors under certain circumstances
- Part 3: Weather risks. Whether fog or thunderstorms, hail or hurricanes: how sailors can recognise early on that trouble is imminent. Plus: How local effects influence the weather on site
- Part 4: Route planning. Using weather information, special services and apps to optimally prepare your own trip - how to do this and what you should pay attention to as much as possible
by Sebastian Wache
Part 4: Weather routing
I have chosen a special place for this last part of the weather series: I'm sitting in our beautiful clubhouse virtually on the water with a view of the Kiel Fjord, the blue sky - and with a harbour cinema. That's because a large number of guest sailors are currently arriving here, seeking shelter from a freshening easterly wind. Those who are still outside have reefed heavily and are struggling a little with the wind conditions. I myself take my time and enjoy one thing above all: yes, the weather too. But above all the reliability of the forecasts. The fact that this weather situation with a Scandinavian high should materialise was already visible in the weather models a week ago. Not in all of them, but in the reliable ones.
From the big picture to the small scale
And this is where the complexity of weather data begins. I will try to shed some light on the subject and also provide some guidance on how sailors can obtain the best possible weather forecast using which data or technical aids. The strategy I always give participants in seminars is to always work your way from the big picture to the small details. Why is that important? We know from the previous parts what the jet stream is, how lows form and also how global wind circulation is controlled. In short, everything is connected to everything else. If I have wind in Kiel, it doesn't necessarily come from a low near Hamburg and a high near Flensburg. This can happen, but the systems are often much larger and much further apart.
You should therefore always keep an eye on the general weather situation. Using a ground pressure map, you can see what is currently happening over your head at any time. You start with an analysis map. This provides information about the current weather situation. This is followed by the forecast maps. These tell you what's in store for you over the next few hours and days. This gives me an initial picture. I can localise highs and lows as well as fronts. At the same time, I can even assign the current cloud pattern to the fronts.
As the usual maps usually only show the ground pressure in the form of isobars, you have to work out the wind direction and speed as well as the possible weather activity and intensity of the fronts yourself - or refer to other maps. But then it gets more complicated. Which maps do I need and where can I find them? We at Wetterwelt have thought about what additional information we can include in our ground pressure maps so that you know more at first glance. The wind arrows with feathers and the intensity of precipitation on the fronts are also shown. The viewer therefore knows immediately how the wind blows around a high and low, and also roughly how strong it is. With regard to the fronts, I can therefore estimate whether they will bring bad weather and whether I need to prepare for precipitation. Or whether only harmless cloud fields will pass over me.
Analysis and prediction
Anyone looking at a weather map should first of all check what they are looking at: If it is an analysis map, the actual situation at a certain point in time is depicted. Such maps are usually produced four times a day, at 00, 06, 12 and 18 UTC. The weather situation is shown with the pressure patterns and fronts measured by weather stations and satellites at one of these times.
Analysis cards
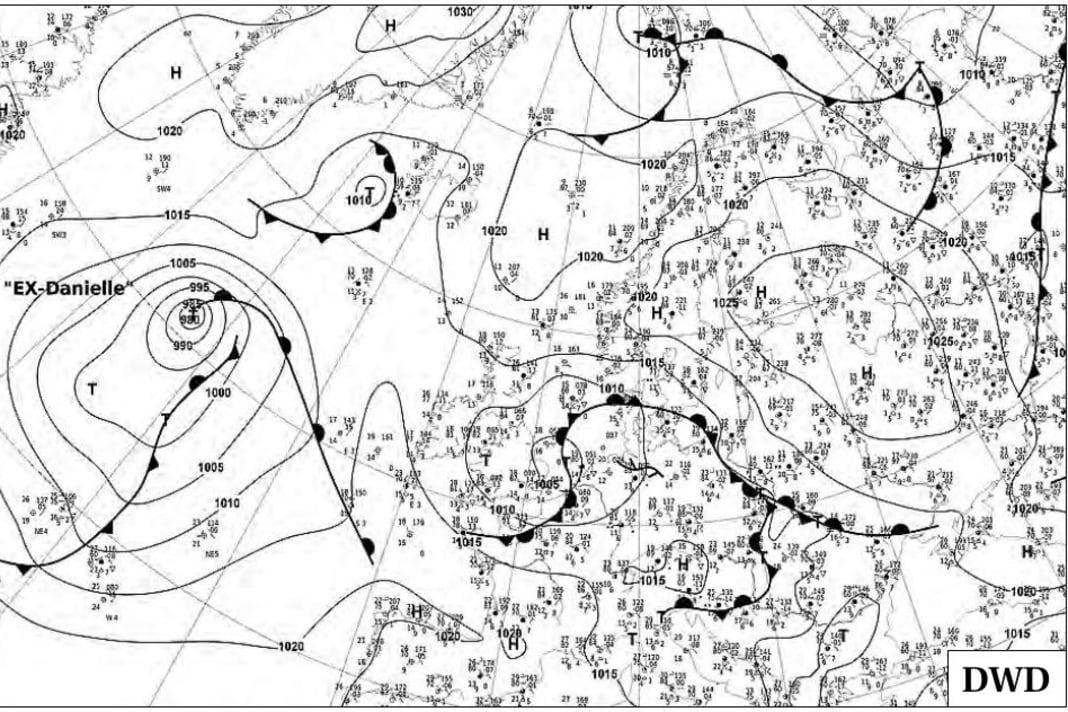


Analysis maps form the basis for forecast maps. They incorporate the weather models of the respective providers or meteorological institutes. They use roughly the same graphics and parameters, only now they say something about how the weather situation is expected to develop in the coming hours or days. The forecasts often differ from provider to provider, as they all work with different weather models when in doubt. These are the underlying mathematical formulas that meteorologists use to calculate the weather development.
Forecast cards
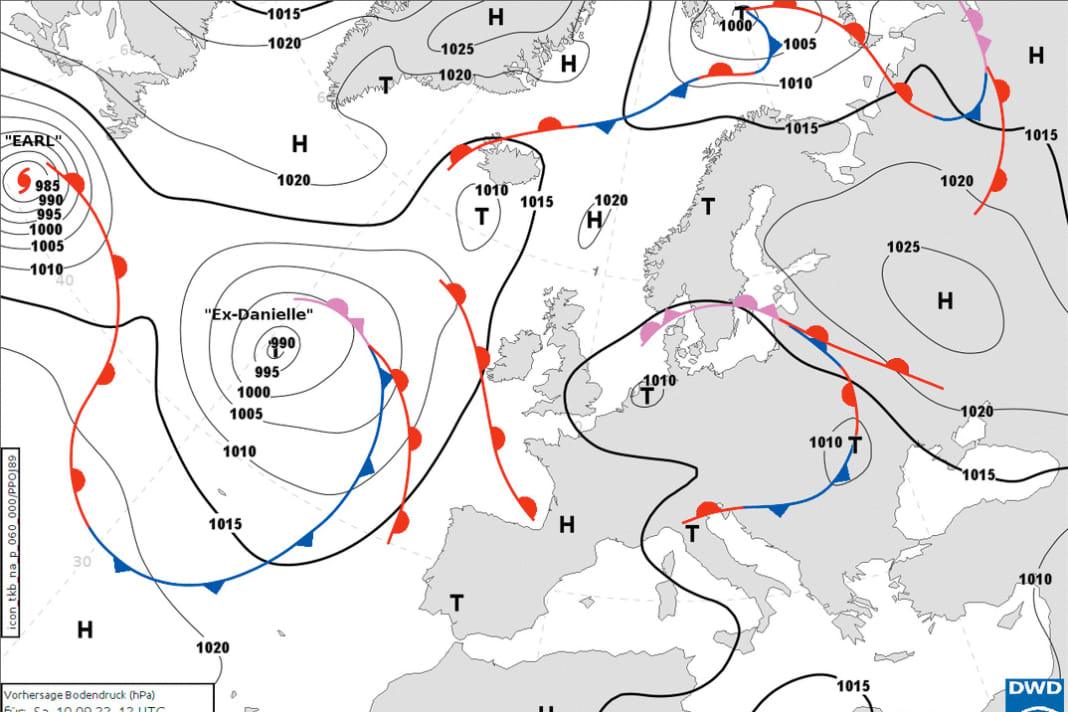


Sailors should compare forecasts from several providers when planning their trip. This will give you a better feel for the direction in which the weather is likely to develop. Even if you already have great confidence in a particular weather model, you should regularly compare it with reality. Rain and lightning radar are helpful here. With their help, you can see whether an area of rain is actually where the forecasts said it would be.
Weather maps alone are not enough
The analysis and forecast maps alone are a great added value if you don't deal with the weather on a daily basis. However, even I find it very difficult to judge from a standard ground pressure map alone whether the fronts will bring heavy, mild or no weather at all. Nevertheless, we should always start with the ground pressure maps. It is best to download these maps to a tablet or laptop so that they are available offline. If you have a printer on board or want to look at the weather at home in winter, print out the maps and place them next to each other on the table.
A little anecdote: Until a few years ago, it was exactly the same in our office. We printed all the weather data on paper and pinned it to the wall. When new models came out, the cards were replaced by the students. All the rooms were papered with weather maps and the printer was running at full speed every day. In the course of the digital transformation, these maps have become completely digital. Now you can work more decentralised and much faster. Above all, however, access to weather data has become much easier, even for non-experts.
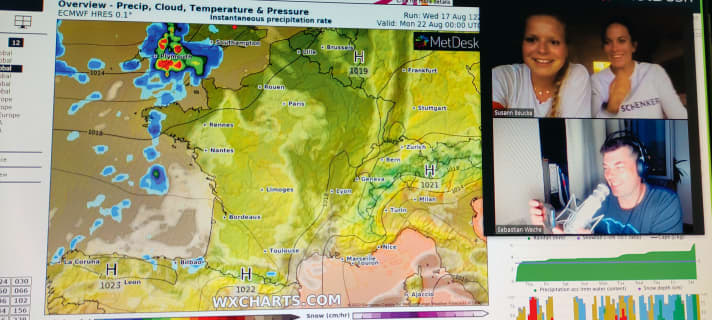
Back to working with the weather maps. I recommend first marking your own location with a cross. This makes it easier to see what will pass over you in the coming hours and days. If a front is approaching, I fall back on the knowledge from part two of the series about what to expect with which fronts. But now it goes into even more detail. I also want to know what to expect on a planned sailing leg along my route. I often see people - including sailors - holding their mobile phones under my nose and asking me whether the forecast on them is correct. These are usually apps that only provide a point forecast. Most people just use the weather apps that are often pre-installed on their devices or apps from the app store - which are usually free - that don't provide an overall picture of the weather.
The weather pattern is important for routing
As with the ground pressure charts, however, it is essential for sailors to know what wind, waves and weather lie ahead over a large area - and therefore also behind the next cape or in the next bay that I want to head for. After all, the weather can be completely different there. In autumn, for example, fog banks can form at sea that were not yet visible when we set sail. The wind out there can also have a different direction and strength than near the coast, for example. I can only recognise all of this if I look at the weather and the time course along the entire route. That's the only way I can protect myself from surprises that shouldn't really be any more.
Same data, different results
It is important to know: Basically, all weather models - the mathematical formulas on which the forecasts are based - use the same measurement data. The basis of the weather around the globe is therefore the same for all models. However, as soon as they begin to calculate into the future, small differences that characterise each model lead to sometimes large differences in the results. The reason: in order to get results quickly despite all the supercomputers, they try to simplify the sometimes incredibly complicated formulae. Everyone involved does this differently. There are also models that incorporate statistics. So you look to see whether the weather situation has existed before and what it was like at the time, and then use the model forecasts to become a little more accurate.
This summer in particular has shown that such models did not cope well with the severe drought, for example, as this had not been seen before in the measurements. Small changes can therefore have a significant impact on the output. One model also reacts more strongly to the development of cumulus clouds than the other, and so one model shows faster and stronger showers than the next.
Which weather model is accurate?
There are many weather models. Almost every national meteorological institute and private weather service providers have their own. The ones that don't cost anything are the favourites of the countless free apps. This means that every programmer can offer a weather app, insert adverts and earn money in this way. Hardly anyone realises that these models, especially the American GFS model, are not that reliable. Those who realise it complain about the poor forecasts, but generally don't know that there is a better way.
The model of the European weather service ECMWF, for example, costs high licence fees for most weather parameters. Other national weather services also charge fees for the use of their data. The investment is worthwhile, as experience and analyses show that the forecast quality is significantly better than others. This means that better forecast models have to be purchased. In this case, it is usually the raw data that can be refined with further post-calculation models. This means that you first buy a very rough forecast for the next ten days for the entire earth. This model is recalculated twice a day. Once you have downloaded this data from the server, you can recalculate much more precisely for smaller areas using your own models.
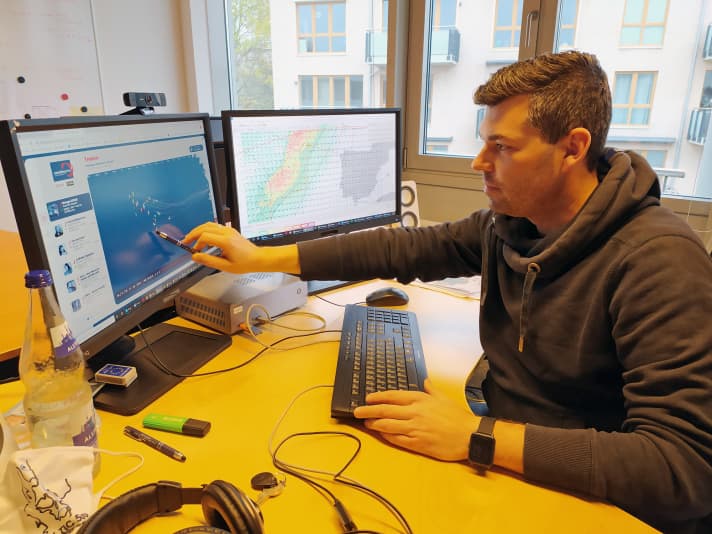
With the GFS model, on the other hand, I can hardly recalculate any better from a forecast that may already be different and therefore incorrect. An example: If the European model predicts a high over Germany tomorrow, then I can expect rather weak winds and lots of sunshine in the fine recalculation. If, on the other hand, the other model predicts a low, then the post-calculation will not bring me any sunshine either. So what is important is what the raw model gives me in terms of forecasts. If they are reliable, I can resolve the whole thing more precisely for my regions, both spatially and temporally, with a clear conscience. In the end, I get forecasts that can tell me exactly when and where the wind will turn for each hour over the next two days, whether it is subject to small-scale effects due to coastlines or similar and where exactly I can expect the strongest weather.
These fine "extra calculations" are not always available free of charge everywhere, as they involve a lot of development work. Good weather therefore has its price - even if it is comparatively low for the sailor in the end: a reliable forecast should be worth 60 to 100 euros a year. At least if you want to do it on your own.
Weather in data format
In order for weather routing apps or programmes to work at all, they have to be fed with so-called Grib data. The abbreviation stands for gridded binary and is a global standard format for meteorological and oceanographic data. These can contain current weather, wave and current information at different depths in the oceans and at different heights in the atmosphere. Sailors usually use the surface data for wind and weather as well as waves and currents at sea level. The apps and computer programmes convert this grib data into graphics. They have long been an integral part of sailing.
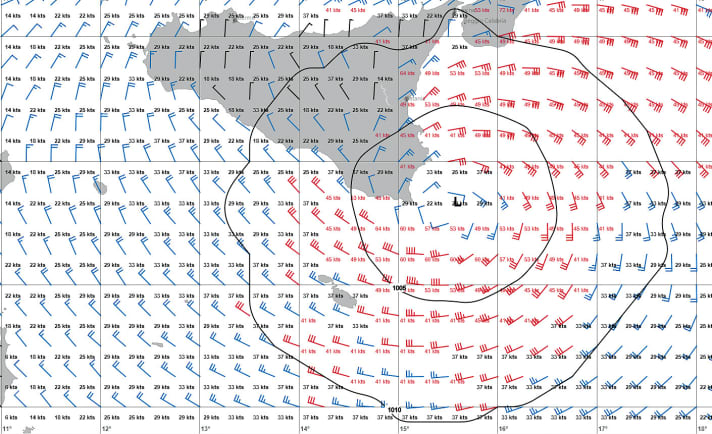
Incidentally, the weather data that you work with, which relates to the ground, already takes into account the processes at altitude. This is not unimportant, because after looking at the ground map, you should actually also look at the altitude for the large-scale weather conditions. As shown in part two of this series with the bottle experiment, it is crucial whether we have warm air masses above cold air masses or whether unstable cold air masses are approaching from above. This is because they can cause the weather to become quite turbulent. But as I said, this information is already translated in the data for the weather layman.
Update the routing
Once you've got an idea of the weather on your route, it's important to always do a cross-check before the start and on the way. I constantly compare the actual situation with what the models have told me. It's an advantage if the data is also available offline. Because as soon as I sail out of mobile phone reception range, it becomes difficult with updates.
If I still have reception, such as in large parts of the Danish South Sea or in the Scandinavian archipelago, then I should always have a weather radar quickly accessible on my mobile phone in borderline conditions. This allows me to see beyond what I can see from the cockpit. I can also see towering cumulus clouds many kilometres away. But with a satellite image or film, which gives me a view from above, it is much easier to determine whether clouds are developing in a more organised way and possibly even heading in my direction.
Use a weather radar app
If precipitation then falls or thunderstorms form, such a weather radar app is even more important. With its help, it is possible to estimate where the centre of gravity of a storm is and where it is likely to move and when. Sites like blitzortung.org or lightningmaps.org are a valuable tool during thunderstorms. An initiative of volunteer hobbyists and thunderstorm enthusiasts has created something ingenious with this open source project. Mapping lightning discharges and their path almost to the second is a technical masterpiece.
However, it is not always easy to familiarise yourself with all the instruments and possibilities so that you can plan your trip with confidence. Especially in times when extreme weather conditions dominate the media on a daily basis, increasing the uncertainty of working with the weather yourself. And this is where we weather routers come into play. We accompany crews and single-handed sailors from start to finish, if required. We enquire about the route, some boat parameters and the reasonable weather conditions. Then we usually start with monitoring. This often takes place three to four days before the planned start. This is the first time we assess the weather situation and its development and see whether a start is even possible. If the date is not feasible due to the weather conditions, we can immediately discuss when a suitable weather window opens up. If it is then possible to start, we will work out an initial routing.
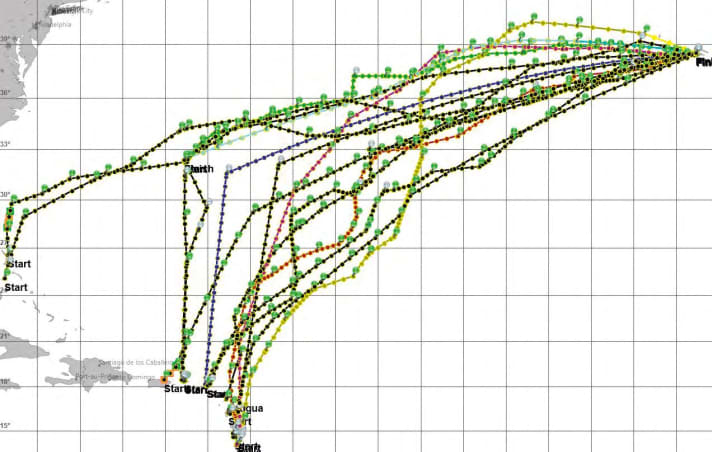
If the route can be covered in three to five days, routing is usually sufficient. If it's more of an Atlantic crossing, modern communication options come into play: A position is sent to me at least once a day via satellite tracker or from on board. This means I always know where the ship is. I track each ship daily and always check the current weather conditions. If the weather conditions are stable, it is usually sufficient to send a routing update to the ship every two to three days. This is done as a text message or satellite SMS to keep costs as low as possible.
If, on the other hand, the weather situation is more dynamic and variable, for example because there are several lows around the ship's location, the frequency of the transmitted texts increases. Even if I see that new information has suddenly emerged compared to the previous day's forecast data, for example because a hurricane has formed, I contact the sailors to warn them in good time and recommend course changes. As it is almost impossible for the sailors to download various models in high resolution over a wide area and view them themselves, I act as a kind of watchful eye for the crews. Especially in volatile weather conditions, this is often the key to maximising safety.
So it also happens that I have intensive discussions with crews several times a day, as I did in May this year. They were travelling from the Caribbean towards the Azores. However, around 150 nautical miles from their destination, a storm depression with winds of over 50 knots formed in the place of the typical Azores high. I recommended tacking for about two days and letting the low pass ahead in peace. A decision that the crew would probably not have made without external knowledge. However, this saved the ship and sailors from major damage on board.
Weather routings are therefore a useful addition to all the data and options that are already available to everyone. Even if it's just a question of whether I should sail to the Danish South Sea or towards Bornholm, or whether it's better to go left or right around Funen - a meteorological assessment from a professional will always help you make your own decisions.
This series has hopefully shown that the events in the atmosphere are not that complex and that working with the weather is not that difficult, in fact it can be downright fun. Starting with the basics, we have delved into the world of weather data and weather routing. Now it's time to build on this knowledge and, ideally, to engage with the topic more regularly. In this way, you will quickly develop a certain routine in dealing with the available data and develop an unmistakable feeling for what the weather has in store for you tomorrow.

Sebastian Wache is a qualified meteorologist; he works as an expert in marine weather forecasting and professional weather routing as well as a cruising and regatta consultant at Wetterwelt GmbH in Kiel. He regularly passes on his knowledge to sailors in seminars and also presents the daily forecast for Schleswig-Holstein on NDR television together with Dr Meeno Schrader. Wache is a keen sailor himself and enjoys sailing on the North Sea and Baltic Sea.
Recommended weather sites on the web
- WWW.WINDY.COM Very complex and all-encompassing
- WWW.WXCHARTS.COM Page with various weather models
- WWW.METEOCIEL.FR Also various weather models, but only in French
- WWW.BLITZORTUNG.DE Lightning radar; shows current thunderstorm cells and their paths
- WWW.SAT24.COM Current satellite images and films for Europe
- WWW.ESTOFEX.ORG Weather warning page. As it is run on a voluntary basis, no guarantee of completeness, but nevertheless a site to be taken seriously
- WWW.CYCLOCANE.COM Good overview of tropical cyclones
- WWW.WETTER3.DE Ground pressure maps and height level maps
Recommended weather apps
- SEAMANThe fee-based web app including routing tool from Wetterwelt
- WINDYVery popular among sailors. Attention, it is the app with the red logo!
- PRECIPITATION RADARThere are various app providers, but the measurement data is the same for all of them
- YR.NO Norwegian app with good model for point forecasts

