Meteorology episode 1: Which parameters influence the weather for sailors
YACHT-Redaktion
· 08.09.2022
In this series:
- Part 1: The basics.Wind, air pressure, temperature, humidity and more. What changes these parameters cause in combination
- Part 2: Of highs and lows. What influence the pressure formations have on wind development, how they develop and which constellations can be dangerous for sailors under certain circumstances
- Part 3: Weather risks. Whether fog or thunderstorms, hail or hurricanes: How sailors can recognise early on that trouble is imminent. Plus: How local effects influence the weather on site
- Part 4: Route planning. Using weather information, special services and apps to optimally prepare your own trip - how to do it and what you should pay attention to when doing so
By Sebastian Wache
Part 1: The basics
Everyone talks about the weather for sailors, and everyone knows better. Besides, weather forecasts are never right anyway, or if they are, then at best for the next three days. These are the common prejudices. Admittedly, nobody can guarantee one hundred per cent accurate forecasts. Nevertheless, studying the weather is fun, despite all the uncertainties involved. You don't need to have studied meteorology to do this. Even laypeople can develop a very good feel for the various parameters and peculiarities of the weather and the models used to calculate it. If you invest a little time, for example, you will quickly learn how to interpret different forecasts so that no nasty surprises await you later at sea. No longer being confronted with unforeseen wind and precipitation developments is actually possible these days - thanks to modern technology and the internet with its fast communication channels!
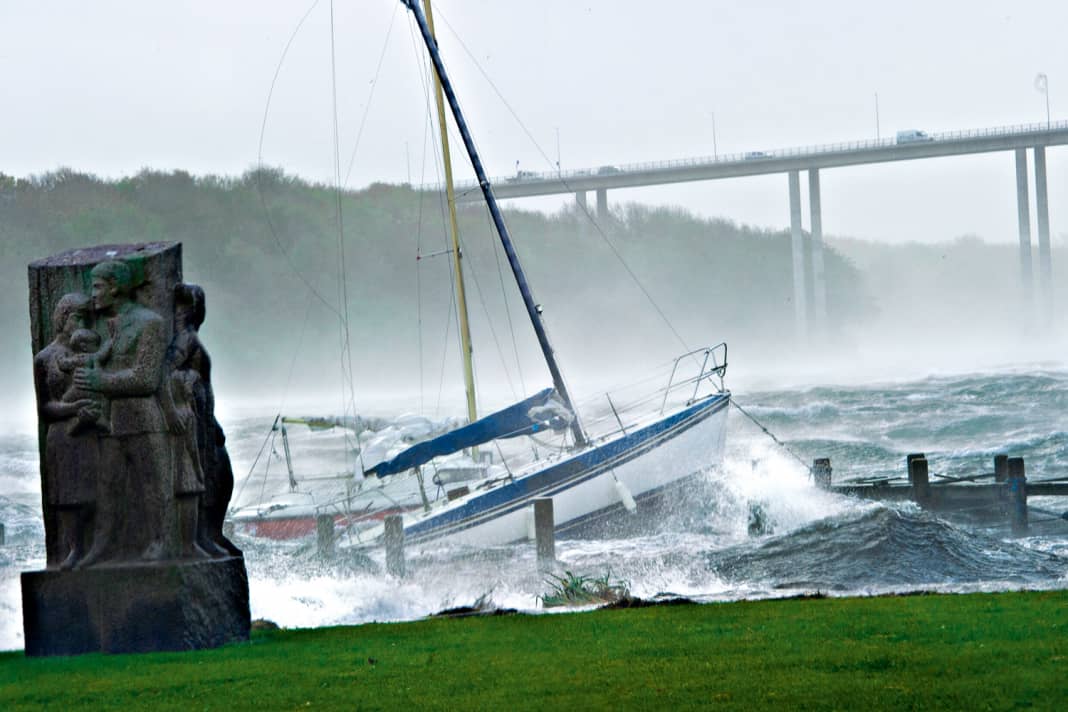


Before plunging headlong into the world of measurement data and colourful weather charts, you should take a look at the basics. Some people may still know a few things from their sailing licence or sailing licence courses. Others, on the other hand, may lack any meteorological know-how at all, even if they have been sailing for some time. Therefore, this four-part weather series is intended to lay a foundation of weather knowledge on which everyone can build.
Weather, weather and climate
Let's start with the different weather parameters for sailors that influence wind and precipitation. But first we need to clarify what weather actually is. Basically, the term refers to nothing more than the current physical state of the atmosphere. Whilst reading this article, why don't you lift your head up for a moment and look out of the window or out of the cockpit? Then what you see now is weather and therefore the current state of the atmosphere around you.
If a certain type of weather, which is typical for the season, can last for several days - for example a foggy day in autumn or a hot spell in summer - then we speak of weather. The third term is climate. It reflects the statistics of weather events over the past 30 years or more. So if you hear that it was 1.5 degrees warmer or 150 per cent wetter last month, then this is based on a 30-year climate reference period. Such statistics, which define certain weather norms, can then be used to determine the extent to which the current state of the atmosphere deviates from the "normal state".
But let's get back to the weather, i.e. the events that take place above our heads every day. Let's start with the first parameter: temperature. Everyone knows how it is measured: with a thermometer. The unit is also familiar: Degrees Celsius. However, this does not apply to the whole world, because in the USA, degrees Fahrenheit are used. There, for example, 32 degrees Fahrenheit corresponds to zero degrees Celsius, 68 degrees Fahrenheit to 20 degrees Celsius. And to top it off, the scientifically correct unit for temperature is Kelvin. Very confusing, so let's stick with the tangible and familiar unit of Mr Celsius.
What the temperature says
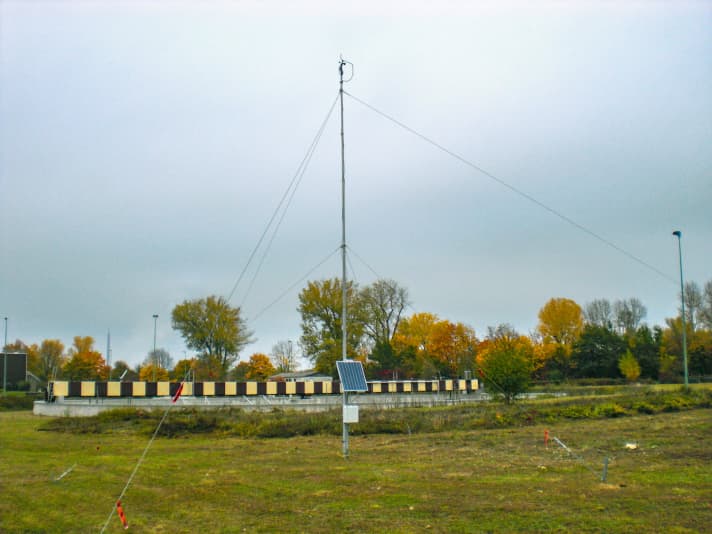
Temperature, in whatever unit, is a measure of how cold or warm an object is. For us meteorologists, this object is air, or rather a parcel of air. This is because we always consider a standard volume of one cubic metre of air, i.e. a box filled with air, each one metre long, high and wide. Depending on heating or cooling, this air parcel can be warmer or cooler. In order to obtain comparability in the measurements, so-called weather or thermal huts are used. These are measuring boxes that are installed two metres above the ground and contain various measuring instruments. One of these is the thermometer.
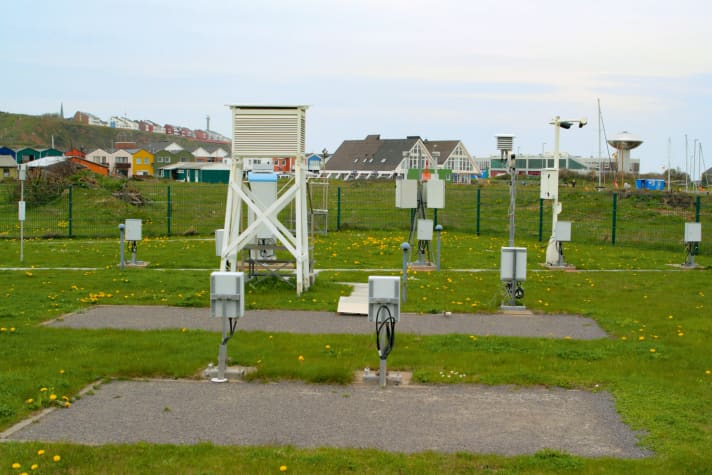
To prevent such a measuring box from heating up excessively in the sun and to ensure that air always flows through it, it is painted white and has louvres on all sides. This ensures that the shade temperature is always measured. The installation at a height of two metres is also intended to prevent influences from the ground, such as heat radiation. Temperatures that you hear in the weather report or see in a weather app are therefore values for a height of two metres.
Interaction of temperature, air and water vapour
Temperature plays a very important role in meteorology, especially its property that cold air has a higher density than warmer air. Cold air is therefore also heavier. Many people know this from their own experience: if you open the window of a heated room in winter to let in fresh air, it quickly gets cold, starting with your feet.
Cold air therefore collects on the ground. This can be impressively demonstrated with a pennant or banner. Simply hold it at the top of the window when airing the room in winter and then at the bottom. The bunting blows out in two different directions: out of the window at the top and into the room at the bottom. In this way, cold and warm air masses circulate separately.
But temperature also has other properties. If we take our air parcel again, it can not only be warmer or colder, but we can also put water vapour into the parcel. Water exists in three states of aggregation on earth: liquid, solid and gaseous. The invisible vapour in particular can be found everywhere, even in the driest deserts on our planet. However, the amount of vapour sometimes varies greatly depending on the season and region. And this is where temperature comes into play again. The warmer an air parcel is, the more water vapour, i.e. moisture, it can absorb. The corresponding measure for this is absolute humidity. It indicates how many grams of water vapour there are in a cubic metre of air. Another measure that is more familiar to most sailors is relative humidity, expressed as a percentage.

Some also have a hygrometer hanging on the cabin bulkhead, which tells you how humid it is below deck. The most accurate hygrometers are still fitted with horsehair. If the hair is wet, it expands. When they are dry, they contract again. A pointer connected to the hair swings in one direction or the other depending on the ambient humidity. It is then often set to 60 or 70 per cent humidity, for example.
Put simply, this figure indicates the percentage of water vapour contained in the air packet out of the 100 percent that could fit inside until it is full. The packet cannot contain an infinite amount of water vapour. Instead, there is a so-called saturation limit, which is 100 per cent. At a relative humidity of 60 per cent, there would still be room, but not at 100 per cent. If you still want more vapour in the package, the only way to do this is to make it warmer.
Warmer air can absorb more moisture. You can imagine it a bit like a sponge: It soaks up water and is full at some point, the water drips out. The warmer air packet now represents a larger sponge. It can hold more vapour. Conversely, the air packet has to release moisture again as soon as the air cools down - or the sponge becomes smaller. In this case, the so-called dew point is reached. This is the temperature to which I have to cool the air so that the water vapour becomes liquid and thus also visible to us humans: in the form of clouds. These are nothing more than water vapour made visible by cooling the air through a specific process. These processes happen every day and almost everywhere around the globe.
In this context, it is also important to know the ratio in which warm and cold air masses can absorb moisture. Because this does not happen evenly. Warmer air absorbs significantly more water vapour than cooler air. An example: An air parcel with a temperature of 15 degrees Celsius can hold a maximum of 12.8 grams of water vapour. If the temperature rises to 30 degrees Celsius, it is already 30.3 grams. For every degree Celsius increase, approximately seven percent more water vapour can fit into the package.
As water vapour is also a source of energy in the atmosphere, everyone can imagine what it means if this energy is released during cooling processes: Severe storms are imminent. More on this in the next episodes.
Air pressure and wind
Let's take a look at two more parameters: air pressure and wind. Air pressure is the pressure that emanates from the entire column of air above us and exerts pressure on every particle and atom - including us humans. On average, the pressure on earth is around 1,013.25 hectopascals or millibars. This corresponds to a weight of 10,000 kilograms pressing down on an area of one square metre. If you go hiking in the mountains, you leave a certain proportion of the entire atmosphere below you, so you have fewer air particles from the remaining column of air above your head. The air pressure therefore drops. When diving, on the other hand, the water pressure is added to the atmospheric pressure. The pressure increases significantly more.
But back to the parameter that interests us as sailors, the ground pressure. It is subject to daily fluctuations and is therefore never the same. At least not everywhere. Wherever the same value is measured, we meteorologists can draw lines connecting the relevant measuring points. The result is the famous ground pressure maps. They show where higher air pressure prevails on the earth and where it is lower. At this point, however, spatial visualisation is required. This is because air masses not only flow horizontally, but are also forced to rise and fall. Such a strong descent can be seen in the pressure centre of a high, whereas a strong upward flow can be seen in the core of a low.
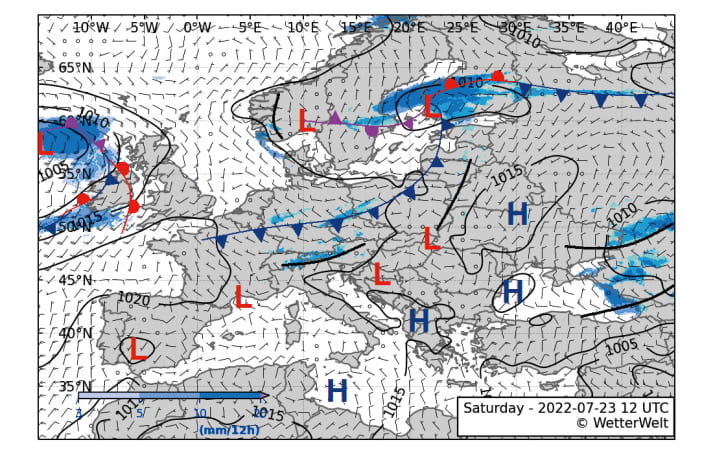
In highs, therefore, more air mass presses on the ground from above. In our latitudes, they usually have ground values of 1,020 to 1,035 hPa. A particularly pronounced high can sometimes reach up to 1,050 hPa. Shallow lows, on the other hand, are usually between 1,000 and 1,010 hPa. Stronger ones reach lower air pressures of up to 975 hPa in this country. On the Atlantic in hurricane lows or in the core of tropical storms, core pressures can even fall below 920 hPa.
Weather stations always measure the local pressure using a barometer. A mountain station, for example, always records a lower air pressure than a station at sea level. However, in order to be able to compare both values in the end and plot them on a ground pressure map, they are calculated down to sea level using formulas. In this way, it is also possible to work with measurements in regions away from the sea. And it is these weather maps that provide us with important information, especially about the wind, our final parameter.
How wind is created
In physical terms, wind is the movement of air. But how does this air get moving? For this we need pressure or, rather, pressure opposites. Let's take an air pump, press the piston down and push the air it contains into a tyre. So we create an overpressure, the air flows into the area with less pressure. You will also notice that the pump gets warm. More pressure therefore also generates heat. Meteorologists refer to this as a high-pressure area. If our tyre is now full, we have our opposites: high pressure in the tyre and lower pressure in its surroundings. If we now open the valve, the air flows again from the high to the lower value, but this time out of the tyre. In this context, we speak of pressure equalisation, which creates wind. In addition, the rapid reduction in pressure in the tyre causes the air to cool down; in meteorological terms, this is a low-pressure area.
It works in exactly the same way with atmospheric structures: The wind always blows from the high to the low pressure area on the earth. This means that a high always fills up a low that has formed. And: the stronger the pressure contrasts, i.e. the pressure in the centre of the high compared to the pressure in the core of the low, the stronger the equalisation. A low with a core pressure of 975 hPa therefore brings more wind than one with only 1,010 hPa. As the atmosphere does not like contrasts at all, but is always in need of harmony, pressure contrasts, but also temperature contrasts, for example, are constantly equalised.
The wind is determined at the weather stations in the open field at a height of ten metres above the ground in order to ensure a clean inflow and avoid environmental influences. If you work as a sailor with wind data in an app or with so-called grib data, these forecasts also always refer to this "ten metre wind". On the ground, for example, friction can lead to different results at the same time, which may no longer completely match the forecast. You should always bear this in mind.
Wind direction and speed
Finally, we come to the units: The wind direction itself is clear. It is subdivided and displayed in the compass rose from zero to 360 degrees in ten-degree increments. The cardinal directions north, south, east and west and the directions in between, such as north-west or south-east, are sometimes more common. However, the degrees are more precise.
The same applies to speed: Mr Beaufort's rather imprecise classifications are more common, starting with wind force zero (calm) up to a maximum of twelve (gale). In contrast, however, knots are increasingly being used. They are more precise and also incorporated into the Beaufort scale. For example, four Beaufort correspond to values between eleven and 16 knots. The worldwide standard unit for wind speeds, on the other hand, is metres per second (m/s). It is also not completely unknown to sailors. It is particularly common in Denmark, as the Danish Meteorological Institute (DMI) has chosen it as the binding unit. However, this is not a problem. If you have the Beaufort/knot table in your head, you can easily convert from metres per second to knots. As a rough rule of thumb, multiply m/s by two and you get the knots. If you now double the knots, you get kilometres per hour.
It is also possible to convert from knots to Beaufort - add five to knots and divide the result by five - albeit quite roughly. The easiest way, however, is to memorise the Beaufort/knot table or stick it in your cockpit for future reference.
So much for the basics of weather parameters, which are also the most important parameters for a weather model and its specific forecasts. It should be noted that warm air is lighter than cold air and can also absorb more moisture. If the air cools down until the so-called dew point is reached, water falls out of the air parcel and becomes visible in the form of clouds. Also important: the air pressure decreases with increasing altitude and the wind always blows from high to low pressure, i.e. from high pressure to low pressure areas.
But first of all, congratulations to you! You have just completed half a meteorology course in fast-forward. At least the four basic parameters have been covered and with them the most important physical processes that serve as the basis for the second part. We can ignore some micrometeorological processes and a few other parameters that also have an effect in the atmosphere for the time being. For a simple and quick understanding of what happens up there above our heads every day, what has been described so far is sufficient.
We will look at the pressure formations and the associated fronts in the next instalment. In particular, many of the physical processes discussed take place simultaneously at the fronts of lows. It is precisely this mixture of parameters and their interactions that can ultimately make things exciting. Cold fronts, for example, are feared by many sailors. No wonder, as they really get the atmosphere moving. From a meteorologist's point of view, however, this is when the weather becomes really interesting. If you can see through the processes, they quickly lose their terror for sailors too.
The author

Sebastian Wache is a qualified meteorologist; he works as an expert in marine weather forecasting and professional weather routing as well as a cruising and regatta consultant at Wetterwelt GmbH in Kiel. He regularly passes on his knowledge to sailors in seminars and also presents the daily forecast for Schleswig-Holstein on NDR television together with Dr Meeno Schrader. Wache is a keen sailor himself and enjoys sailing on the North Sea and Baltic Sea.

