Apps for sailing: How to turn your smartphone into a mobile on-board instrument


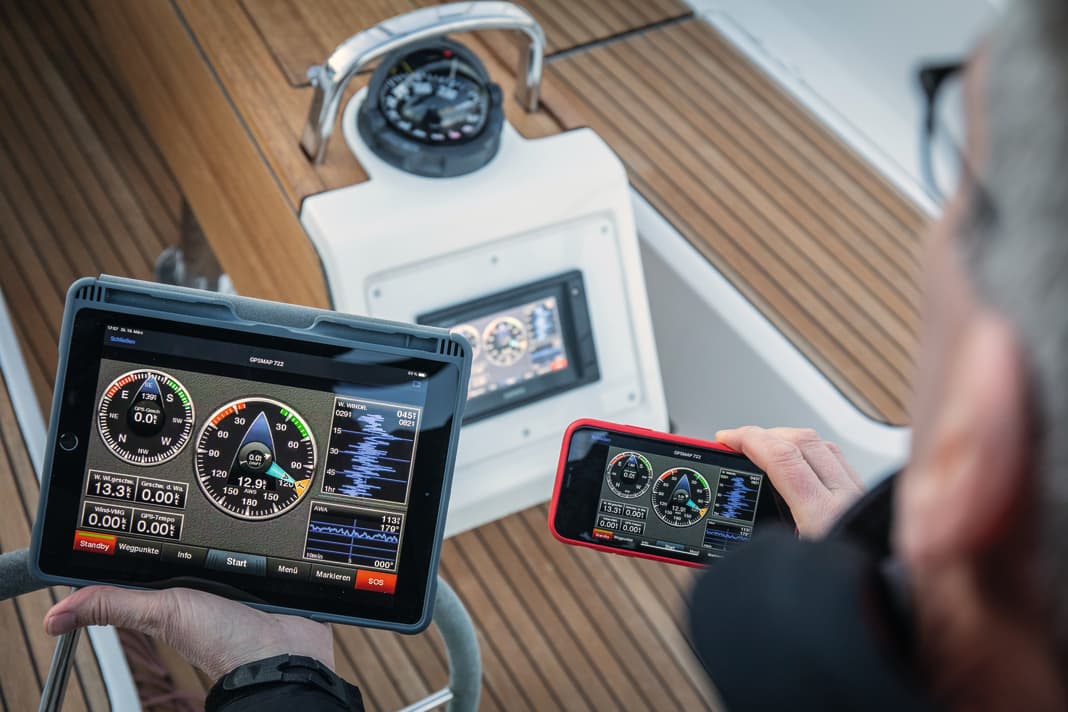
Manufacturer-specific apps are required to mirror the chart plotter display, while universal alternatives are available for instrument data. This means they can be viewed anywhere on board using a tablet or smartphone. These three apps are the most suitable and some of them are even free of charge:
AirmarCAST

The app connects via Bluetooth to the DST810 sensor from Airmar, which is installed in many new boats. In addition to displaying the log, perpendicular, water temperature and heeling angles, the sensor can also be extensively customised. If you are not satisfied with the simple linear correction of the speed, you can even adjust the log for different heeling angles.
Display0183M

If you have a Wi-Fi gateway on board, you can use the app as a subsidiary display for the instrument system. The simple appearance conceals many functions including a sail display, as known from B&G plotters. Pre-set and customised polar data can be used for the approach courses. Data such as speed, depth or course can be displayed as a number and progression diagram. The app can also create a track.
- only for iOS
- free of charge
navCentre

Another subsidiary display app for instrument systems with a Wi-Fi gateway. The data can be displayed in numerical or analogue form. Any number of pages can be customised. If the on-board system allows the reception of NMEA0183 data via Wi-Fi, autopilots with Seatalk interface can be controlled. The app can also be used with the Apple Watch.
- only for iOS
- 6 euros per year or a one-off payment of 10 euros
